In a Splunk PS deployment, I come into the office on Monday mornings and see something like the following when looking at my contact’s desk:

- Three devices, all connected to the network, display three different times
- The customer’s organization definitely operates its IT infrastructure in only one country, in this country there is only one time zone, so there is no apparent reason why two different time zones are also seen
OK, so not even 5 minutes have passed and we already know this is going to be a busy week ![]() .
.
Time zones in global companies
Many companies are present in our globalized world and many locations on different continents, so the watches with the current times could look like this:
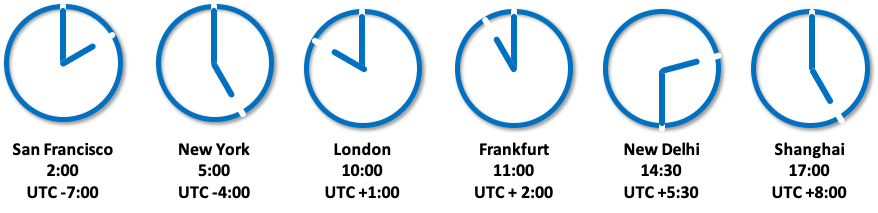
Let’s look at a few facts about time zones in general:
- There are different time zones in regions like AMER, EMEA, APAC, different time zones in countries
- 4 main time zones in the USA – EST, CST, MST, PST
- 11 Time zones in Russia
- 12 time zones in France – world record!
- Time zones with 30 minutes shift like India
- Time zones with or without daylight saving time, daylight saving time changeover on different days(New York: 08-MAR-2020 to 01-NOV-2020, London 29-MAR-2020 to 25-OKT-2020)
So we can see that the issue of time zones is quite complicated in itself, even without IT or Splunk.
The following image reproduces the content of a dialog from another PS project, which a specialist manager somewhere in Germany had with a Splunk administrator in Malaysia, who wanted to inquire about the group’s sales from the previous day in Thailand:

The seemingly simple question of yesterday’s sales becomes quite complicated when three different time zones are involved: do we mean “yesterday” in Germany, Thailand or Malaysia?
Some IT administrators make life easy for themselves and defined their world exclusively in UTC, which specifically means they set all servers to UTC time, regardless of their actual location:

This approach is somewhat pragmatic, but is probably only a solution from the point of view of the server administrators, if you mainly look at the logs of your own server with tail -f. The following aspects should be considered before switching all servers to UTC:
- This approach deliberately generates false log entries, which, among other things, is likely to violate many companies’ policies on proper logging of operations in IT systems. It is certainly not easy to explain to an auditor that he can only understand the logs if he has to add 7 to 8 hours in his head and also take into account the different dates of the daylight saving time changeover.
- Not all IT systems can be set to UTC, there are significant hurdles beyond the “normal” server world:
- Does the CEO want to run his notebook in UTC?
- What about medical devices or IoT devices in general?
- What do we do with IT systems operated by external companies?
The bottom line is that in most cases it’s a bad idea to fight the complex issue of global time zones with simple answers like “everything on UTC”.
Timestamps and time zones in Splunk
Let’s take a look at how Splunk handles this issue. To do this, we first look at the process of processing the data in Splunk. In the parsing phase, the incoming data stream is first broken down into individual events (line breaking), then the time stamp with the corresponding time zone is determined for each event.
The timestamp detection runs roughly according to the following rules:
- A timestamp with time AND date was found in the event
- Use the rules defined in
props.conffor host, source, sourcetype (follow the order) - Use the default values for TIME_PREFIX, MAX_TIMESTAMP_LOOKAHEAD, TIME_FORMAT
- Use the rules defined in
- A timestamp with time but WITHOUT date was found in the event
- Use the time from the event and the date from the log file name
- Use the time from the event and the date when the log file was modified (modtime)
- No timestamp was found in the event
- Use the time from the previous event mii the same values in source
- Use the time of the forwarder
- Use the time of the indexer
- Save the timestamp as epoch / Unix format with milliseconds (if available), so normalized to UTC
The time zone is determined in this way:
- Use the time zone of the event (e.g. PST, -0800) as in the following example:
- Use the TZ attribute in
props.confif the event has the appropriate value for host, source, or sourcetype. In the following example, we set the time zone for all hosts starting with “sf” (San Francisco) to PST for Pacific Standard Time, and for all hosts starting with “ny” (New York) to EST for Eastern Standard Time.
- Use the time zone of the forwarder (Splunk version 6.x)
- Use the time zone of the server that parses the event
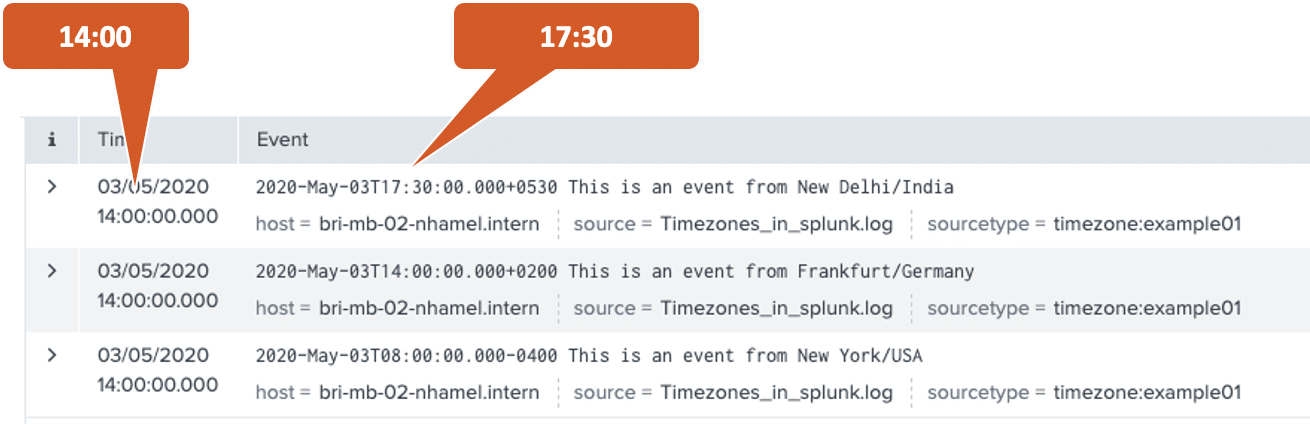
Let’s look at an example with 3 servers in New York/USA, Frankfurt/Germany and New Delhi/India.

All 3 servers are set to the local time zone and each write a log line with the local time to our test log file at the same time (14:00 in Frankfurt):
Without any special configuration, we load the test log file into Splunk, the default settings detect both timestamp and timezone correctly – after all, the timezone is present in the log entry in the example. In the search index=main each event shows the unchanged timestamp as in the test log file, so for New Delhi 17:30, for Frankfurt 14:00 and for New York 8:00. The column “Time” shows the same time for all of them, the local time in Frankfurt at the time when the events were written (14:00).
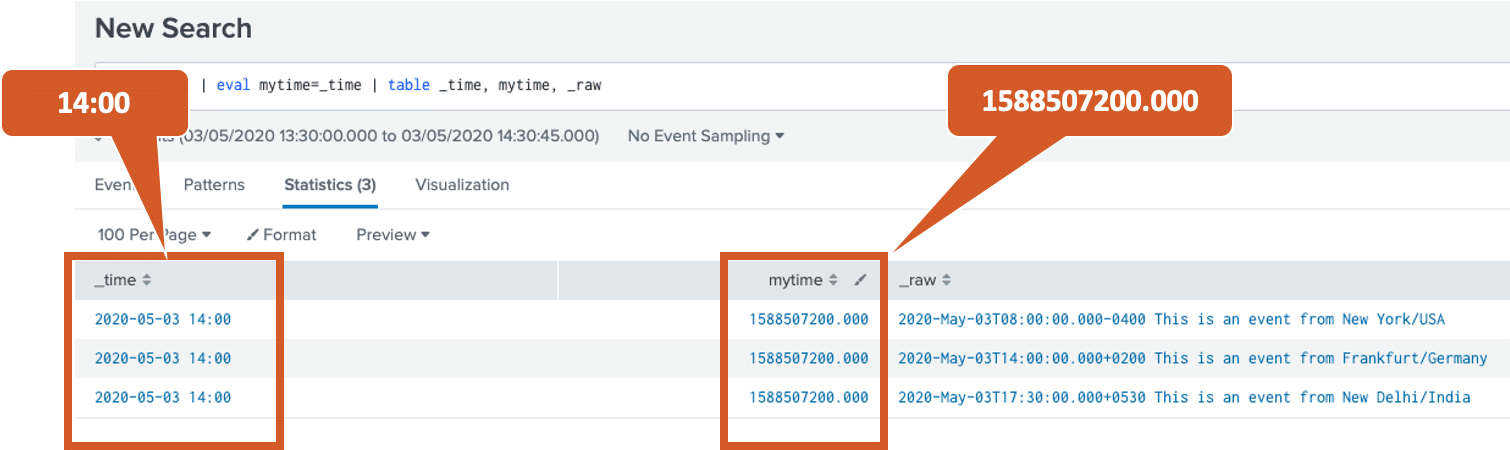
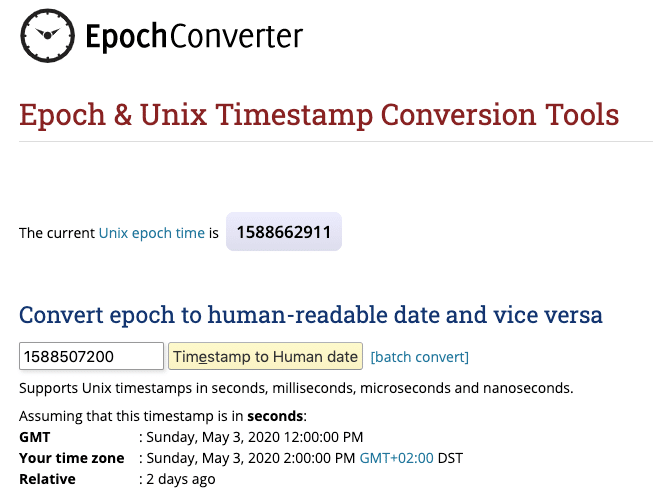
With a slightly modified search, we can display the time stored internally by Splunk, the epoch or Unix time, which is the same for all events:
The Splunk GUI displays the internal field _time not as 10 or 13 digit epoch time, but in the human readable format. The field mytime created with eval, on the other hand, shows the internal epoch representation:
Why does the GUI show the field _time now exactly as 14:00? This is due to the time zone setting in the user profile. The time zone “Berlin” is currently set for the user here:
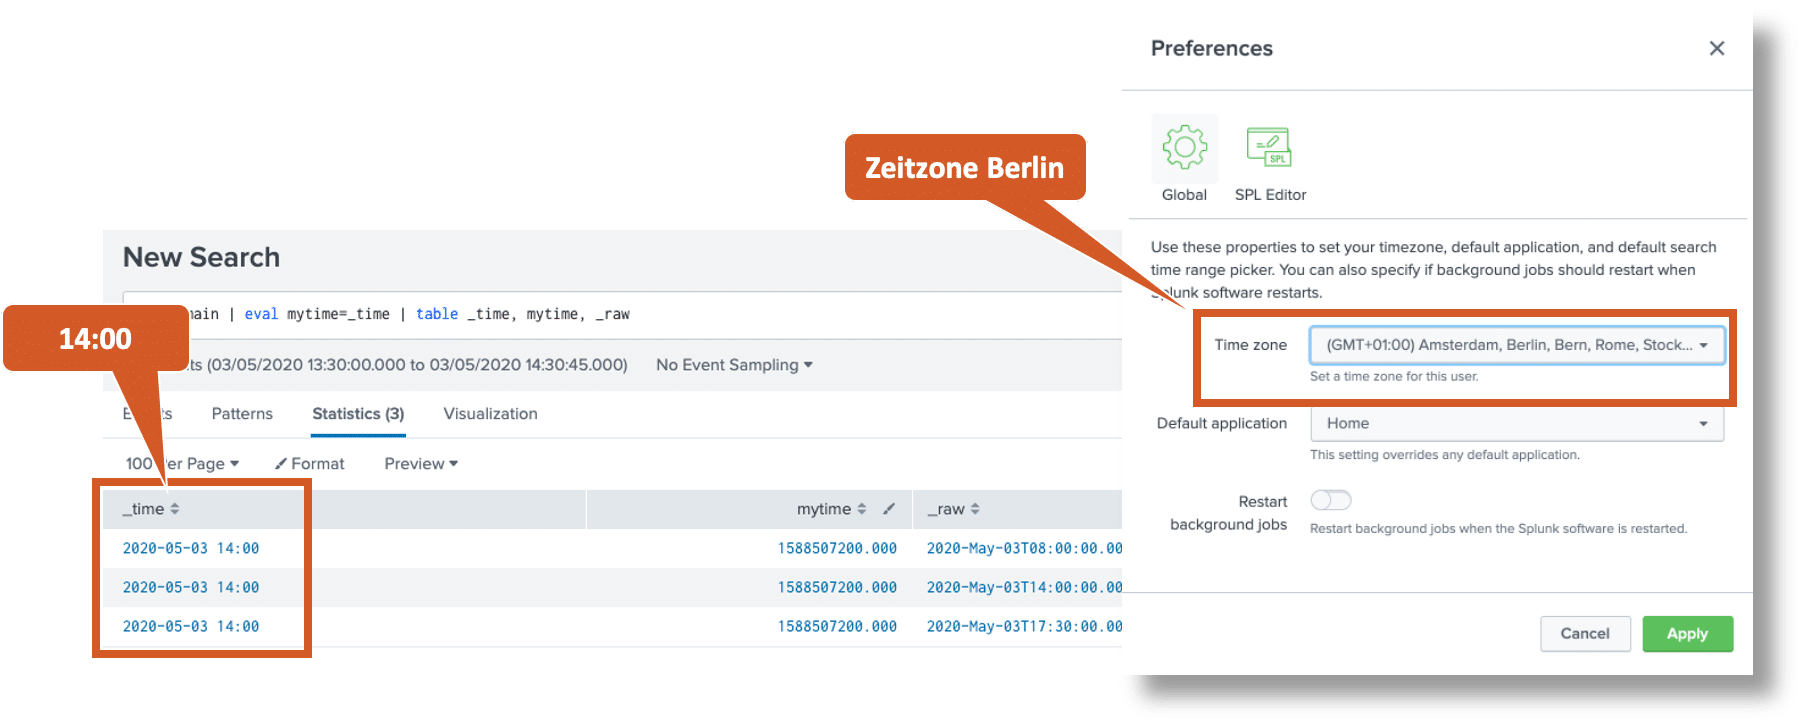
That’s why the epoch time 1588507200 is displayed as 2pm on May 3, 2020 for the GMT+02:00 time zone, as we can verify for example here.
If we select a different time zone in the user profile, for example New Dehli in India, then the same events will be displayed with a different time:

Now that we know how event timestamps are processed both internally and when displayed in SplunkWeb, let’s look at the temporal limits of a search. Each Splunk search uses two values to narrow the search period:
earliest: The beginning of the search period, must always be specifiedlatest: The end of the search period, if not specified “now” is used.
The values selected by the user for earliest and latest are converted back to epoch times internally. We can find this representation e.g. in the Job Inspector > Search job properties > searchEarliestTime & searchLatestTime:

For testing, we run any search with two different time zones in the user profile using “Last 24 Hours” and compare the values found in the Job Inspector:
- searchEarliestTime same for both searches
- searchLatestTime minimally different (due to the change of the profile settings)
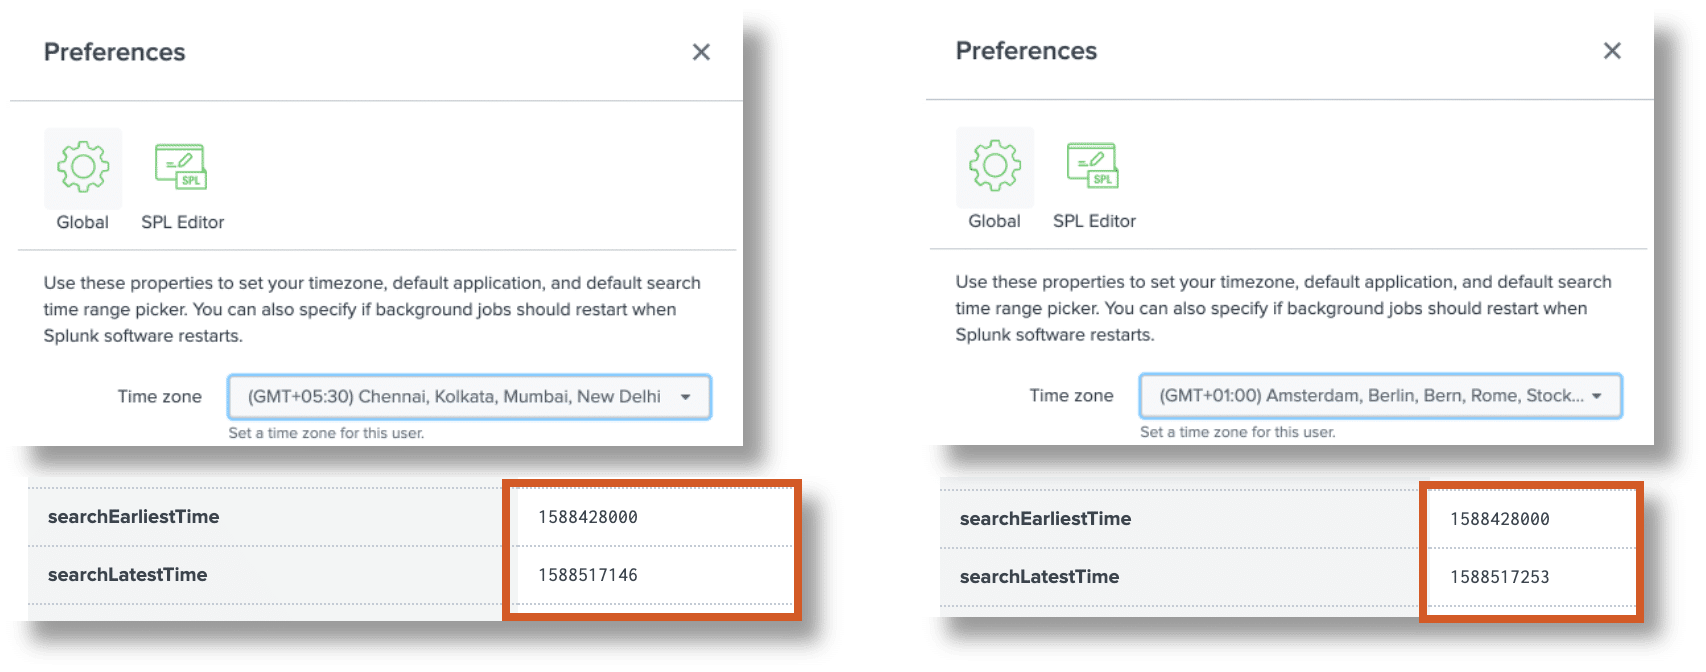
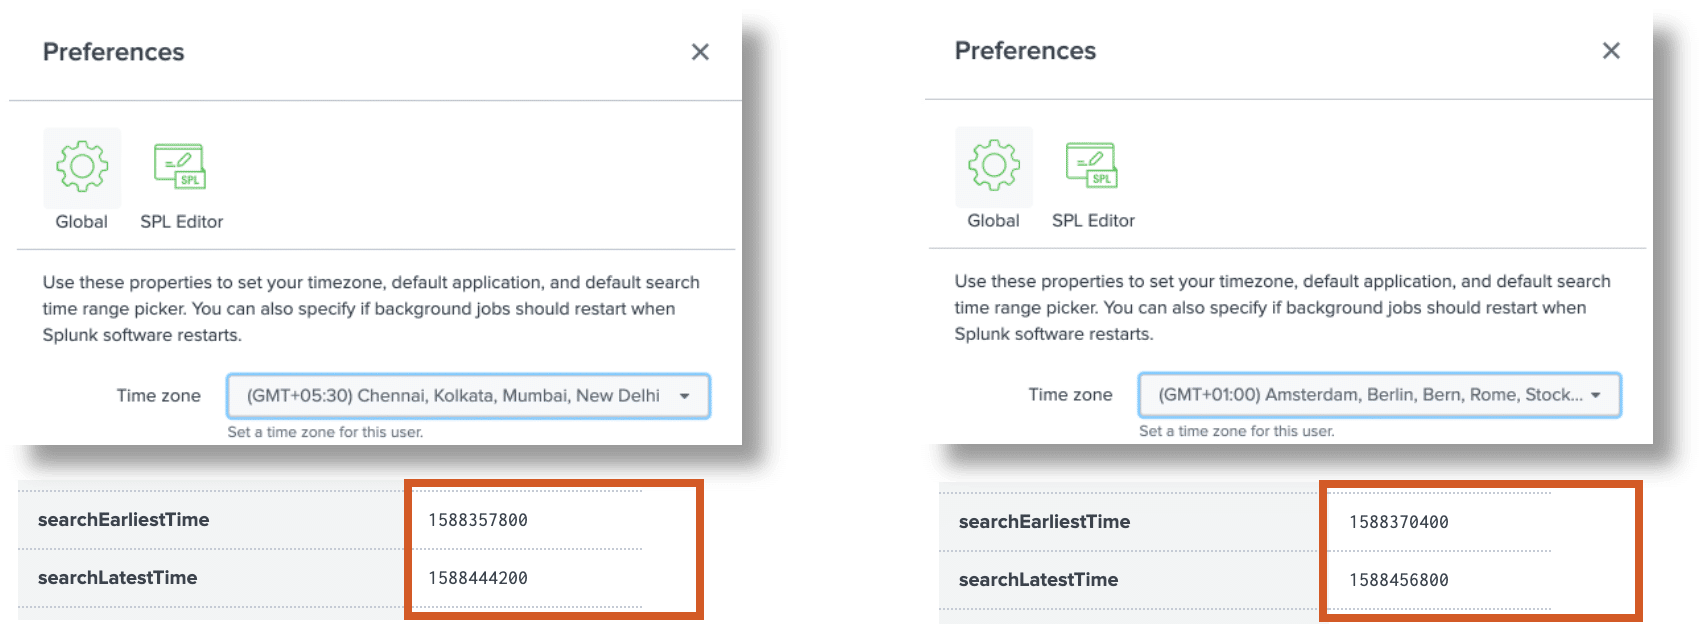
So in this case it makes no difference which time zone we choose in the user profile, the search period normalized to UTC is the same. But what about other search periods? To do this, we again run a search with two different time zones in the user profile, but this time using “Yesterday”:
- Both searchEarliestTime and searchLatestTime are now significantly different
- The difference between searchLatestTime and searchEarliestTime is exactly 86400 (1 day), so it represents the period “Yesterday” correctly
- The difference of searchEarliestTime between the two searches is 12600 seconds (3.5 hours), which exactly corresponds to the different shift of the time zones Berlin and New Dehli.
Summary:
- Splunk uses the epoch format normalized to UTC internally to store the timestamps of the events
- Splunk also uses the epoch format internally for searches
- To display the timestamps in the GUI, Splunk uses a human-readable representation of the epoch times, which are adapted to the time zone selected in the user profile.
- When saving timed searches or alerts, Splunk uses the time zone selected in the user profile to determine the time to run the search and the search time window
- For searches with fixed hour or day limits, always check whether the desired times are actually used.
In the next article in this series, we will then look at how to configure Splunk in various scenarios so that the correct time zone is always detected when data is read in.
By the way, we also offer jobs. Learn more here.