In this blog post, you will learn about different ways to integrate graphics into a Splunk dashboard.
We recommend you to watch the related YouTube-Video „Grafiken in Splunk Dashboards einbauen – Splunk in 5 Minuten” for visual examples and a more detailed explanation.
Option 1: Simple XML dashboard with access to the Splunk Search Head file system
If we have access to the Splunk Search Head file system, we can upload the graphic file to the app directory. Let’s say we create a dashboard in the app Search and Reporting, then upload the graphic to the following directory: $SPLUNKHOME/etc/apps/search/appserver/static. If this directory does not exist in the app, we create it and make sure that both the directory and the files uploaded later belong to the user who also runs Splunk. In this example we upload the logo of the company, so here is the file with the name BC_Logo_Standard.png.
Then we create a Simple XML Dashboard with a simple search. The source code then looks like this, for example. We have removed the default formatting values for better readability:
Now, if we want to place our company’s logo on the top right, we add another row with the following HTML code on top:
Important: Please note that the path to the graphic here is /static/app/ , while the actual path in the operating system is /apps/>/appserver/static.
Now the dashboard looks like this:

Option 2: Simple XML dashboard without access to the Splunk Search Head file system.
However, in some cases, we do not have access to the Splunk Search Head file system. In this case, we can at least convert simple graphics to Base64 encoding and simply add them to the dashboard source code. To do this, we visit a website that converts our graphic to base64 code, such as https://www.base64-image.de/. This produces a very long string that looks something like this when shortened:
data:image/png;base64,iVBORw0KGgoAAAANSUhEUgAABLcAAAEXCAYAAABf3KZHAAAACXBIWXMAAC4jAAAuIwF4pT92AAAgAElEQVR4nO3dTVIdR9bw8...
We can then put this code back in the dashboard in an HTML element:
Now the dashboard looks like this, completely without access to the file system:

Important: Please note that these graphics may not be picked up when sending a dashboard via email because the sendemail function in Splunk does not process graphics as expected.
Option 3: Studio Dashboard
In Dashboard Studio, graphics are currently only supported in ‘absolute’ layout. It offers a wide range of functions that can be selected via drop-down menus.
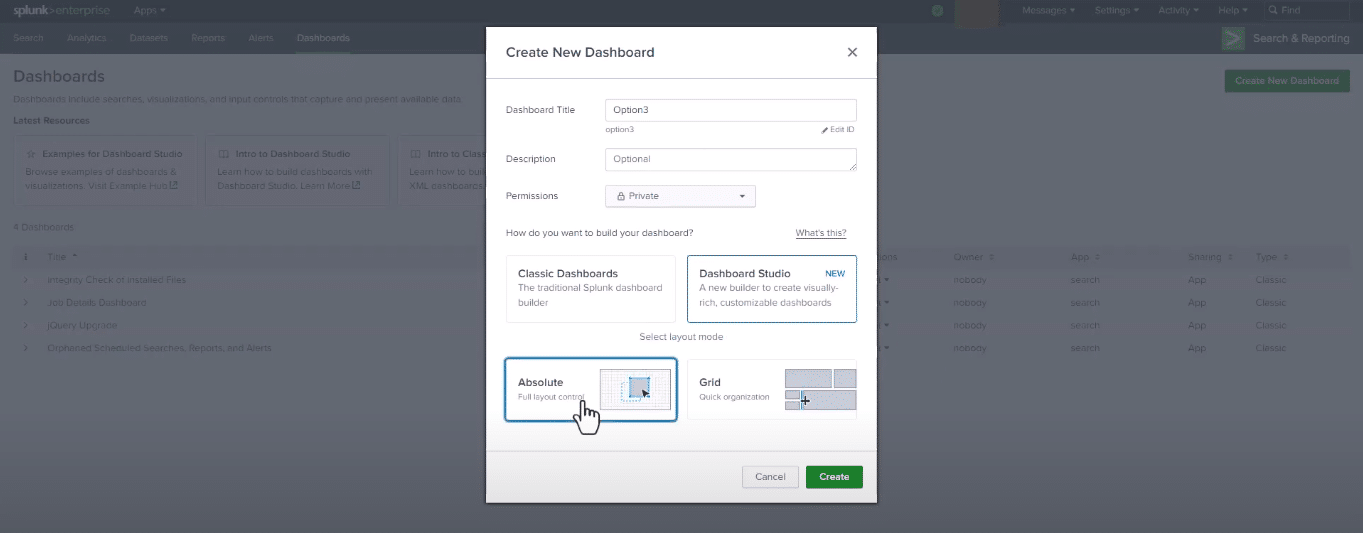
We create a new dashboard again and this time we select “Dashboard Studio” and the “Absolute” layout:

First we choose a white background to get a result comparable to the previous options. We click on the ‘Add Image’ icon (top bar) and can then simply drag and drop the image file to upload it or navigate through the file system and select the appropriate file. The size of the image file can be easily adjusted by zooming in or out, or we can enter the dimensions if we want it to be completely accurate. It is just as easy with the position, either we drag the element to the desired location or specify the X and Y position exactly.
The bar chart we also select from the drop-down menu and here we can easily specify the search as well as the title. The size and position can also be flexibly adjusted as with the image file.

