The central task of forwarders in a Splunk infrastructure is to read in data and forward it to indexers. In most cases, this involves multiple indexers rather than a single indexer. To distribute the read-in data among the available indexers, the forwarders use a built-in and Splunk-specific load-balancing mechanism. In this article, we will look at the different load balancing options in Splunk and discuss the appropriate settings for different application scenarios.
Why is the correct configuration of load balancing important?
With the configuration of the load balancing we significantly influence the distribution of the read data on the indexers. Distributing the data as evenly as possible has significant implications for three aspects:
- Processing time of the data on the indexers: If we distribute 1 GB of raw data equally among 4 indexers (each gets 250 MB), then all 4 indexers will take about the same amount of time to process this data. For a reference indexer, this could take about 1 minute. If, on the other hand, we distribute the data very unevenly (indexer A gets 700 MB, all others 100 MB), then indexer A already needs almost 3 minutes to process the data, while the other 3 indexers are already bored.
- Memory utilization on the indexers: With the uneven distribution of data also comes a possibly extreme uneven utilization of memory on the indexers. The local hard disks or allocated storage areas in a network-based storage are almost fully utilized after some time with some indexers, while other indexers may still have 50% free capacity. As a result, we either have to expand the storage space earlier than necessary, or on the more loaded indexers, buckets may be deleted earlier than others because size-limiting limits of the indexes and volumes are reached.
- Search time on indexers: A similar problem to indexing unevenly distributed data then occurs with searches. The Search Head must wait until it has received the results from all indexers before it can complete the search – so the Search Head waits for the slowest indexer. While searching over evenly distributed data takes about the same amount of time on each indexer (perhaps 25 seconds) and thus the search is finished after 25 seconds, the indexer with a high percentage of data may take 70 seconds, while the less busy indexers are finished after only 10 seconds. So the total search time is the same, but the user has to wait longer for the cumulative result.
So we can see that there are plenty of reasons to set load balancing on Splunk forwarders as well as possible to prevent performance or memory issues.
Load balancing by time or volume
We can basically set the load balancing on a Splunk forwarder according to two criteria:
- Time: In the outputs.conf of the forwarder we define the autoLBFrequency parameter (default: 30 seconds).
- Volume: In the outputs.conf of the forwarder we define the parameter autoLBVolume (default: 0 bytes, this option is thus disabled)
The forwarder switches to the next of the available indexers as soon as the first criterion is reached.
So, in the default setting, we see purely time-based load balancing on a forwarder, where the indexer is changed after about 30 seconds. For this change, the forwarder uses the so-called Random Round Robin method, where the forwarder does not always select the indexers in the same order. With 4 available indexers, this change can look like this, for example:
- Run 1: 1,2,3,4
- Run 2: 4,1,2,3
- Run 3: 2,4,3,1
- Run 4: 1,3,2,4
Load balancing of parsed and non-parsed data
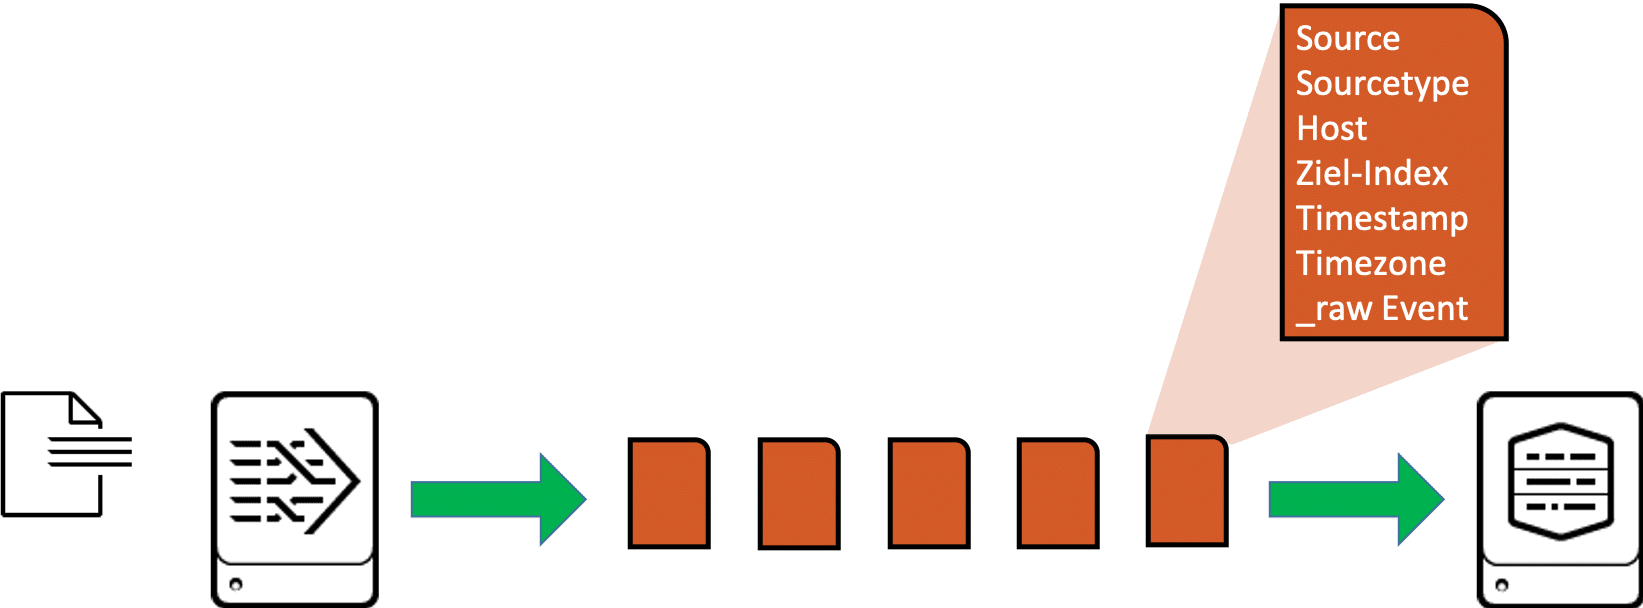
Load balancing for parsed or non-parsed data behaves differently for Splunk. First, let’s take a look at how a heavy forwarder works. The first heavy forwarder in a chain of forwarders and receivers usually handles the parsing of the data it processes. This means above all that it splits the data into individual events and then also forwards events to the next recipient. Each individual event carries not only the original content of the log message (_raw event) but also the complete meta information such as source, sourcetype, host, target index, timestamp, time zone, etc.
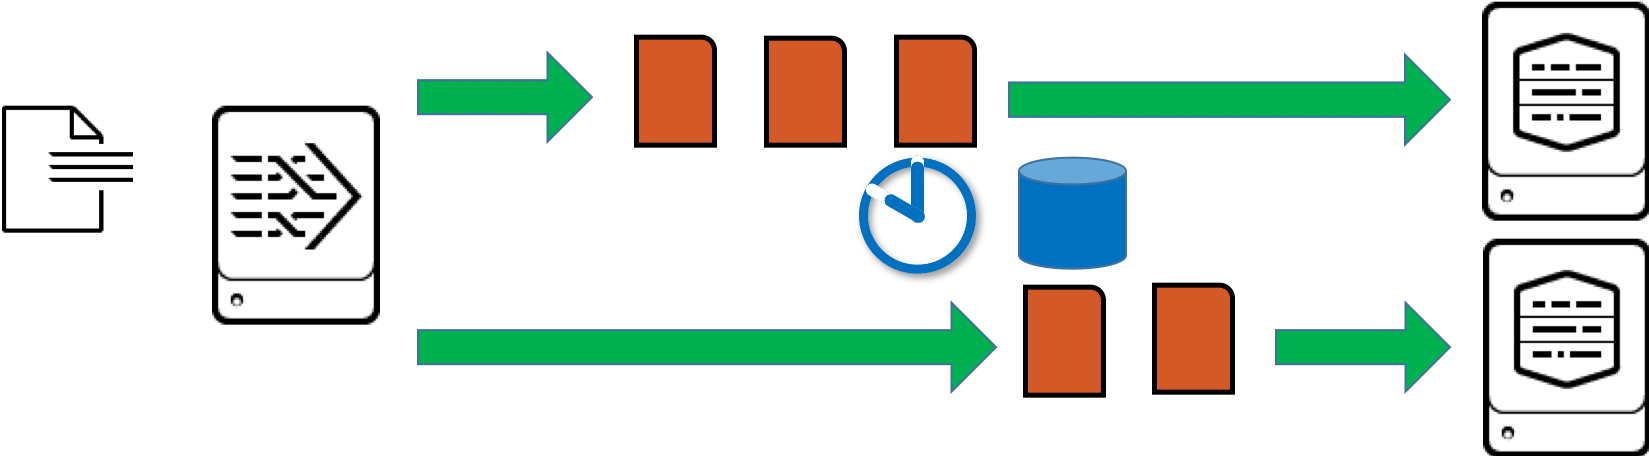
The heavy forwarder is therefore very good at recognizing when it is “safe” to switch to another indexer in time-based load balancing, because the RF can switch between two consecutive events when the interval for load balancing has expired:

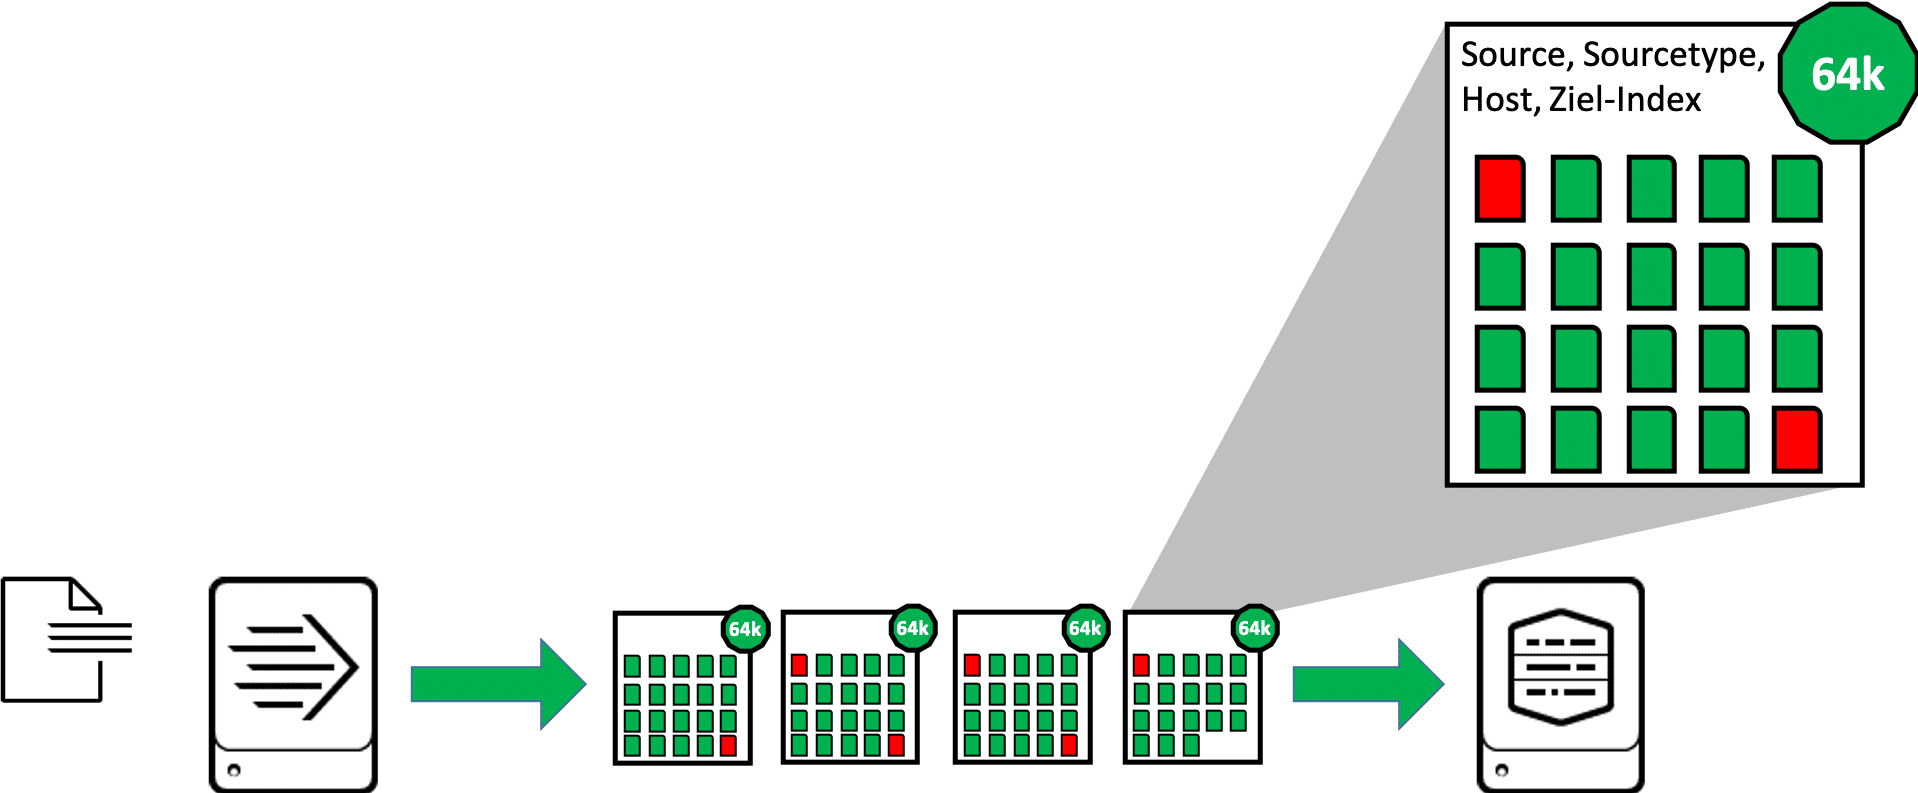
Load balancing is fundamentally different for a universal forwarder. In most cases, the Universal Forwarder does not recognize individual events, but only processes blocks of data. These blocks are 64kB in size for file inputs (8kB for TCP/UDP inputs). For the whole block the most important meta information (source, sourcetype, host, target index) is appended, so in one block also only data with the same meta information is included. For the whole block the most important meta information (source, sourcetype, host, target index) is appended, so in one block also only data with the same meta information is included. This event is thus distributed over two consecutive blocks, in the graphic these partial events are shown in red:
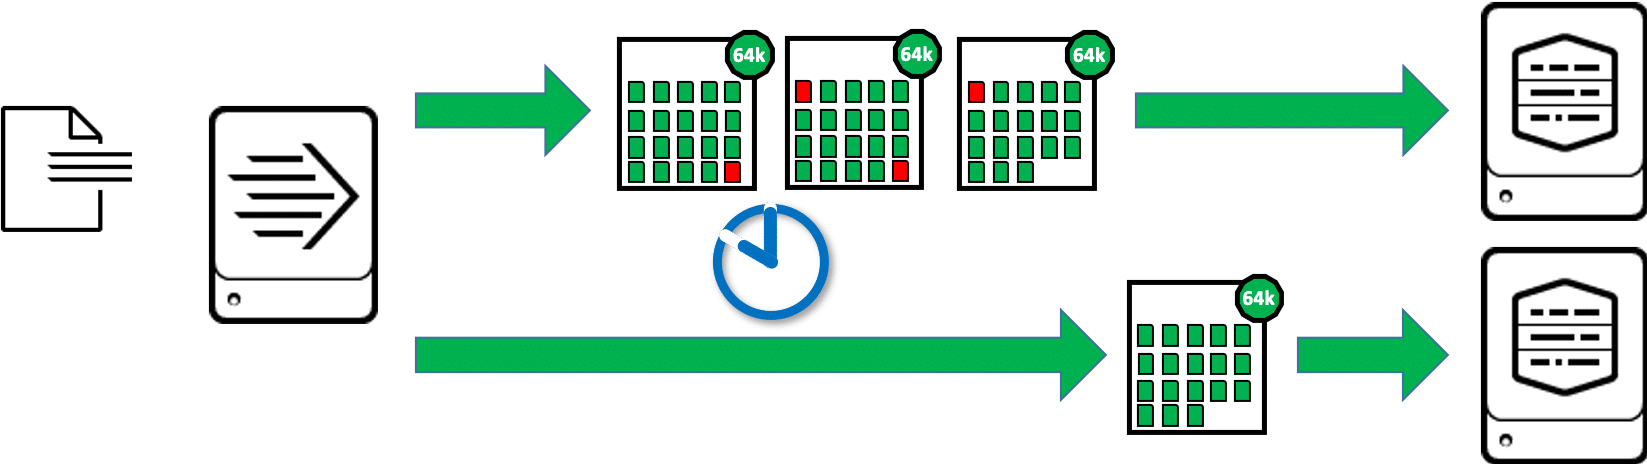
The universal forwarder cannot simply switch to the next indexer after a 64kB block during load balancing, because one part of an event may have been transferred to one indexer and the rest of the same event to the next indexer. So the universal forwarder has to wait until the data stream of these 64kB blocks with equal values for source, sourcetype and host is interrupted. This is the case, for example, when the UF reaches an End of File (EOF) in a monitored file, or when a network input stops receiving data for a certain time:
We will return to this behavior later.
Test setup

In the following tests, we will simulate different load balancing situations with different data inputs, using the following experimental setup:
- 1 Search Head, in this example CentOS 7 with IP address 192.168.4.50. On the Search Head, we configure the search on the 4 indexers in distsearch.conf:
- 4 Indexer, CentOS 7 with IP addresses 192.168.4.51 to 192.168.4.54. On the indexers we configure the receiving port 9997 in inputs.conf:
- Additionally, on the indexers, we roll out the app
bri_lb_test_parsingthat includes theprops.conffor proper parsing of the sample events. - 1 Universal forwarder, in this example CentOS 7 with IP address 192.168.4.55, on which we use the
bri_lb_test_forwarding, which contains theinputs.conffor monitoring the tests logs, plus theoutputs.confwith the various settings for load balancing and the scripts for generating the test logs.
Test 1: Continuous data input
In the first test, we create with a script lb_test_continousfile a log file and continuously write a new entry to this file at 0.1 second intervals For this we use the following call of the script:
The script generates 10,000 entries, so it runs for about 15 minutes, giving us plenty of time to observe the load balancing behavior. We can make the change of the forwarder to the different indexers visible with the following search on the Search Head:
The events that we call like this look something like this:
So we see that the forwarder more or less regularly changes the indexer to which the forwarder sends the data. The time interval is usually about 30 seconds, sometimes about 60 seconds. Most importantly, the order is not uniform, so we recognize the Random Round Robin procedure already presented above.
Additionally, we can check the active connections on the forwarder’s command line:
If we run this command again after one minute, we will see, for example:
After the script has written all 10,000 entries, the following search shows us the distribution of events over the indexers, where we find the indexer in the field “splunk_server”:
The result looks something like this:
Thus, the distribution of events across indexers is not uniform for this very simple, short-term data input, ranging from 11% to nearly 37%. In practice, however, we can assume that the distribution will balance out over time.
Test 2: Upload a large file
In some use cases we cannot continuously read the log files directly after writing new entries with a forwarder, but the log information is collected at the point of origin before it is made available for further processing in larger blocks after a certain time. This can be, for example, when log files are collected in one network segment and transferred at fixed intervals (once per hour or once per day) to another network segment using synchronization, where they are then monitored and read in using a Splunk forwarder. Some IT systems also collect the log information internally until, for example, a certain size of data volume is reached, and only write the log information out of the encapsulated system to a log file on an accessible storage location when the appropriate limits are reached. In both cases, larger log files are created at regular or varying intervals, which are “suddenly” read in by a Splunk forwarder.
In the second test, we want to check how such larger files behave with regard to load balancing. To do this, we first create a log file with 500,000 entries in a location that is not monitored by the forwarder:
:
After the file is completely created, we move it to a directory monitored by Splunk Universal Forwarder:
The file created for the test with 500,000 entries is about 63 MB in size. So with the default setting of the Universal Forwarder with a maximum throughput of 256KBps (maxKBps in limits.conf) it takes a little more than 4 minutes to transfer this file. We can check the distribution of events from the large file across indexers with the following search:
We can see that all events from this file are found on a single indexer, and have not been distributed to all indexers as desired.
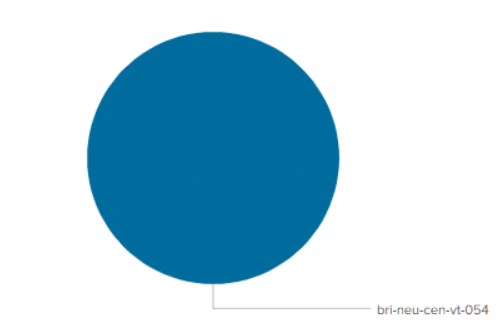
This is due to the behavior of the universal forwarder when load balancing unparsed data – the forwarder sends all data blocks to the same indexer until it finds an EOF in the monitored file. And in this case, it will not find that until it has read in and processed the entire large file.
Test 3: Enable forceTimebasedAutoLB
How can we make the Universal Forwarder change the indexer after a certain time even if no EOF was detected? To test this, we set the forceTimebasedAutoLB = true in the outputs.conf of the forwarder:
After restarting Splunk to make the changes in the outputs.conf active, we again create ourselves a large file:
Once this file is written, we move it to the upload directory:
If we now display the distribution of the large file on the indexers we see that all servers have received entries.
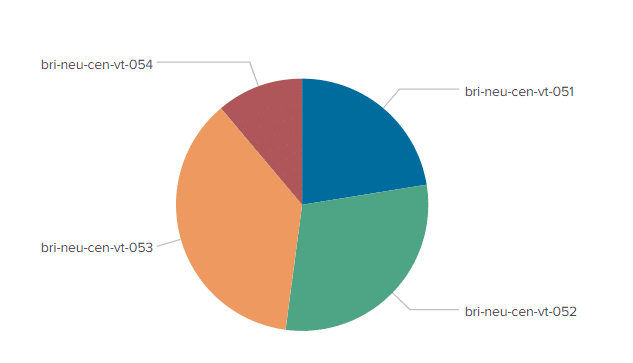
How is it that the data is now better distributed, although the data blocks of 64kB are still sent?
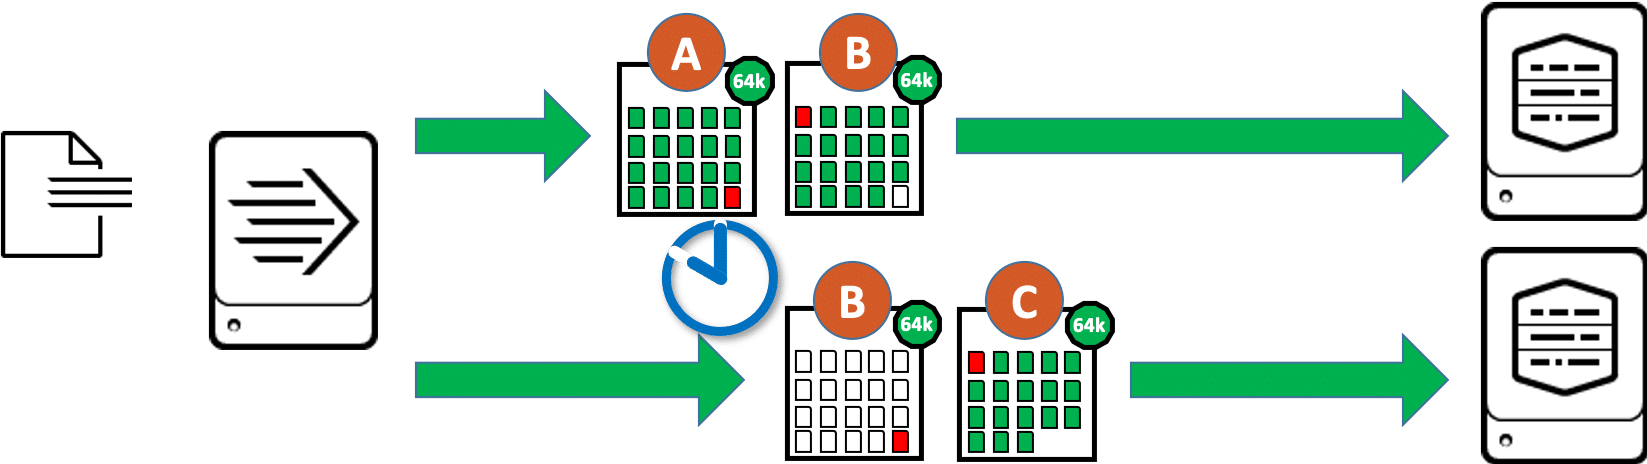
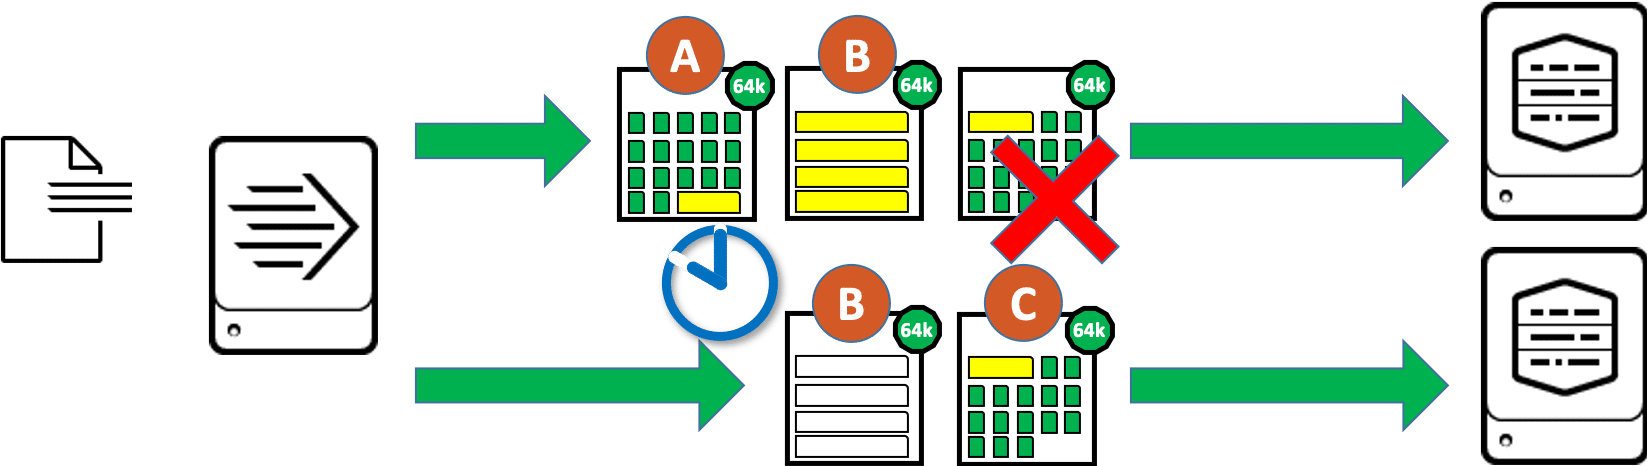
In this case the forwarder sends the last data block before the indexer change twice, here in the picture the block (B):
- The first copy of this data block goes to the previously connected indexer, the forwarder thereby explicitly marks this data block as the last block of a sequence in forceTimebasedAutoLB mode. The indexer receives this block, parses the events and keeps all but the last started event of this block. This partial event is discarded.
- The second copy of this data block goes to the next other indexer, the forwarder thereby explicitly marks this data block as the first block of a sequence in forceTimebasedAutoLB mode. The indexer receives this block, parses the events and keeps only the last started event of this block. This event is then continued in the following block (C). All other events from block (B) are discarded.
So by sending a 64kB data block twice, the forwarder can now switch indexers even if it has not yet detected an EOF in the file.
Test 4: forceTimebasedAutoLB for very long events
But what happens when an event is larger than 64kb? In some cases it happens that individual events become extremely long. Popular candidates for this are structured events in XML format, or plain text events that contain large XML structures as payload.
For the next test, we will create a new large file, this time consisting of very long events. For this we use the script lb_test_longevents.py with the call below:
After that we move the file with the long events to the upload directory:
When looking at the distribution of events across the indexers, nothing negative stands out. With the following search we show the corresponding events, and there we also see nothing conspicuous at first, the events look as desired, start with a timestamp and also look otherwise inconspicuous:

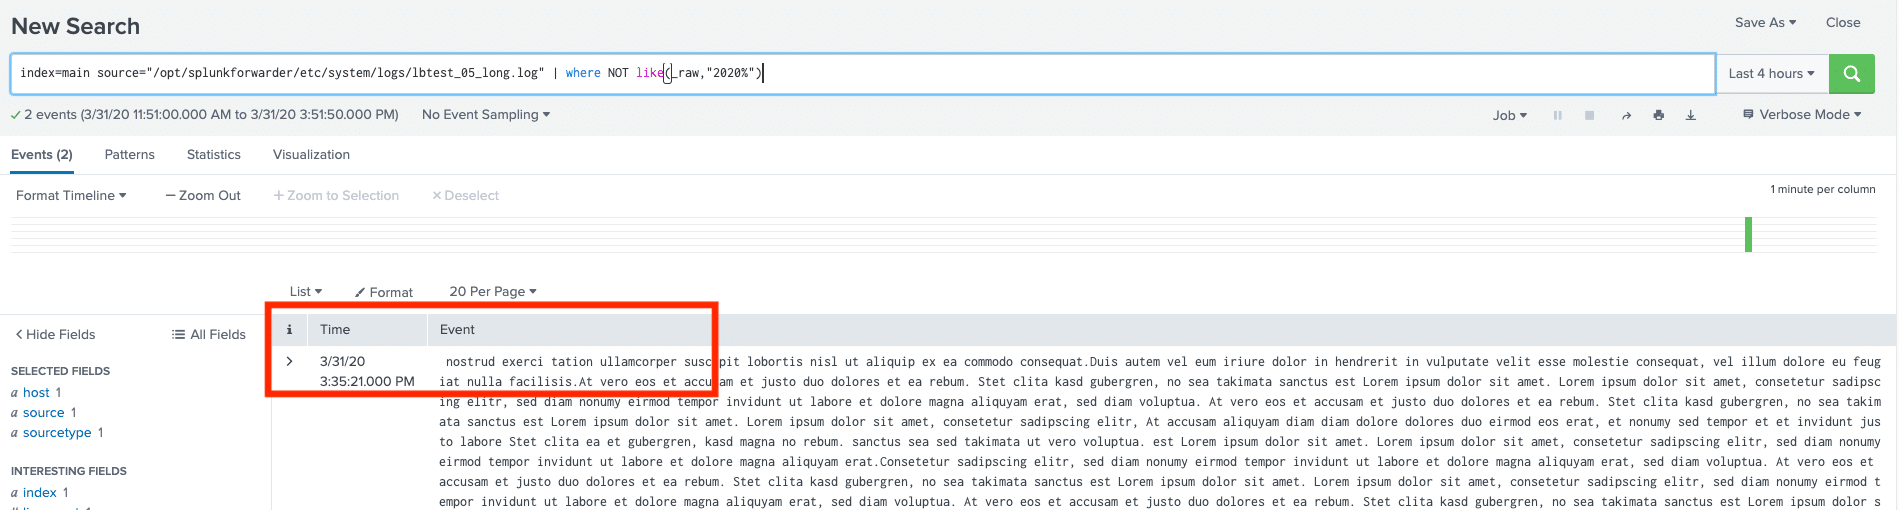
Then we expand the search and search specifically for events that do not start with the timestamp:
We now see that there are a few events that start “in the middle” and not with a timestamp:
Why are the events now truncated just because they are longer than 64kB? We have seen above that if this option is enabled forceTimebasedAutoLB = true the forwarder sends a data block twice when switching indexers, once to the previous indexer and once to the next indexer. If the events are larger than the data blocks, it is possible that individual events are distributed over 3 data blocks. And in unfavorable cases this long event (shown in yellow in the graphic) is just in the area where the indexer is changed. The consequence:
- The first indexer receives the data blocks (A) and (B) and initially keeps the complete events from block (A). For this purpose it finds in block (A) the long, yellow event which is continued in block (B). But the first indexer does not receive the data block (C), where the rest of the long yellow event would be found. Finally, the first indexer stores an event truncated at the end.
- The second indexer contains the data blocks (B) and (C). From block (B) as a copy of the transfer to the previous indexer, it discards anything that does not look like the start of an event. Since we are in the middle of the event here, the indexer doesn’t recognize a timestamp, i.e. no start of an event, and eventually discards everything from this data block. Since data block (C) is again a “normal” and not a copied data block, it is processed completely. So the rest of the long yellow event is processed here as a separate event until the next event in this data block starts. This fragment of an event probably does not have a valid timestamp, so the timestamp is determined using one of Splunk’s default rules. Most likely, the event in this case inherits the timestamp of the last event with the same value for Source.
Test 5: EVENT_BREAKER
With version 6.5, Splunk introduced the EVENT_BRREAKER feature. That was a few years ago, yet many users and administrators still don’t know about this option. With version 6.5, Splunk introduced the EVENT_BRREAKER feature. The UF will still not parse the data, but with knowledge of the event boundaries, the UF can trigger the switch to the next indexer exactly between two events when load balancing. The forwarder’s adherence to an indexer for very large files, the double transfer of data blocks with the forceTimebasedAutoLB and the problem of overlong events are thus completely eliminated.
First, we disable the forced time-based load balancing in the forwarder’soutputs.conf with forceTimebasedAutoLB = false.
Then, we set in the props.conf on the UF for the selected sourcetype the parameter EVENT_BREAKER_ENABLE = true, to enable event boundary usage on the UF. To do this, we tell the UF where the boundaries between events are with the EVENT_BREAKER = ([\r\n]+) parameter:
:
If we repeat the previous test, we find that all events are now transferred and indexed completely and without errors.
Conclusion and recommendation:
In the test scenarios performed, we’ve seen that the default setting with a time-based load balancing of 30 seconds is only an initial suggestion to enable load balancing in the first place. However, only in very few cases is this setting actually the best option. As a “best practice” for load balancing, one can use the following rules:
- Fully configure line breaking for each sourcetype on the indexers (or for intermediate heavy forwarders on these IHF instances) in the
props.confwithLINE_BREAKER = <regulärer Ausdruck>andSHOULD_LINEMERGE = false - On the universal forwarders, as close as possible to the data source in the
props.confenable the use of event boundaries and copy the regular expression for that sourcetype intoEVENT_BREAKER = <regulärer Ausdruck>. - On the universal forwarders in the
outputs.confdset the parameter for the frequency of time-based load balancing to a value higher than the default, e.g.autoLBFrequency = 60. This way, we avoid too frequent changes of the indexer, which can otherwise lead to problems with the mass setup and teardown of TCP connections between universal forwarders and indexers. - On the universal forwarders in the
outputs.confdset the volume-based load balancing parameterautoLBVolumeto a value as close as possible to the amount of data transferred in the set interval. With the default 256kBps, for example, this is about 15 MB.
With these settings, we have a basis for load balancing that does not require an excessive number of TCP connections to be established and released, and yet we achieve a fairly even distribution of data / events across the indexers. From this basis, we can then further optimize the values, e.g. for forwarders with significantly higher data throughput.
By the way, we also offer jobs. Learn more here.